The dashboard pack
Everything on the Use cases pages is a query you paste into the console. This is the same four questions as a dashboard you import once.
# 1. the mapping, so dsl.hash aggregates instead of falling apart into words
curl -XPUT localhost:9200/_index_template/os-query-digest \
     -H 'Content-Type: application/json' \
     --data-binary @resources/dashboards/index-template.json

# 2. the dashboard — pick the file that matches your Dashboards major
curl -XPOST localhost:5601/api/saved_objects/_import?overwrite=true \
     -H 'osd-xsrf: true' \
     --form file=@resources/dashboards/os-query-digest-opensearch-2.x.ndjson
Both files live in
resources/dashboards/
in the package you already installed, so vendor/mr-dlef/os-query-digest/resources/dashboards/
is the path on a real project.
The fields moved in v0.15.0
They were os.* and are now dsl.*. The key is something you type into
queries and panels every day, so it has to stay true for as long as you keep
them — and the library digests Query DSL, which OpenSearch, Elasticsearch and
every API compatible with them speak, rather than one named engine.
Coming from an earlier version: re-apply the index template, re-import the
pack, and either re-index or keep the old field mapped alongside. Nothing
about your fingerprints changed — q6: is untouched, so a hash stored
under os.hash and one stored under dsl.hash are the same hash and can be
compared across the move.
Two files, and it is not a mistake
Dashboards 2.x bundles vega-lite 4 and 3.x bundles vega-lite 6, and
the plugin refuses a specification whose $schema names the other one. The
two packs are generated from the same source and differ in that URL and in
nothing else — a test asserts exactly that, so neither can quietly become a
fork of the other.
What you get
| Panel | The question | How |
|---|---|---|
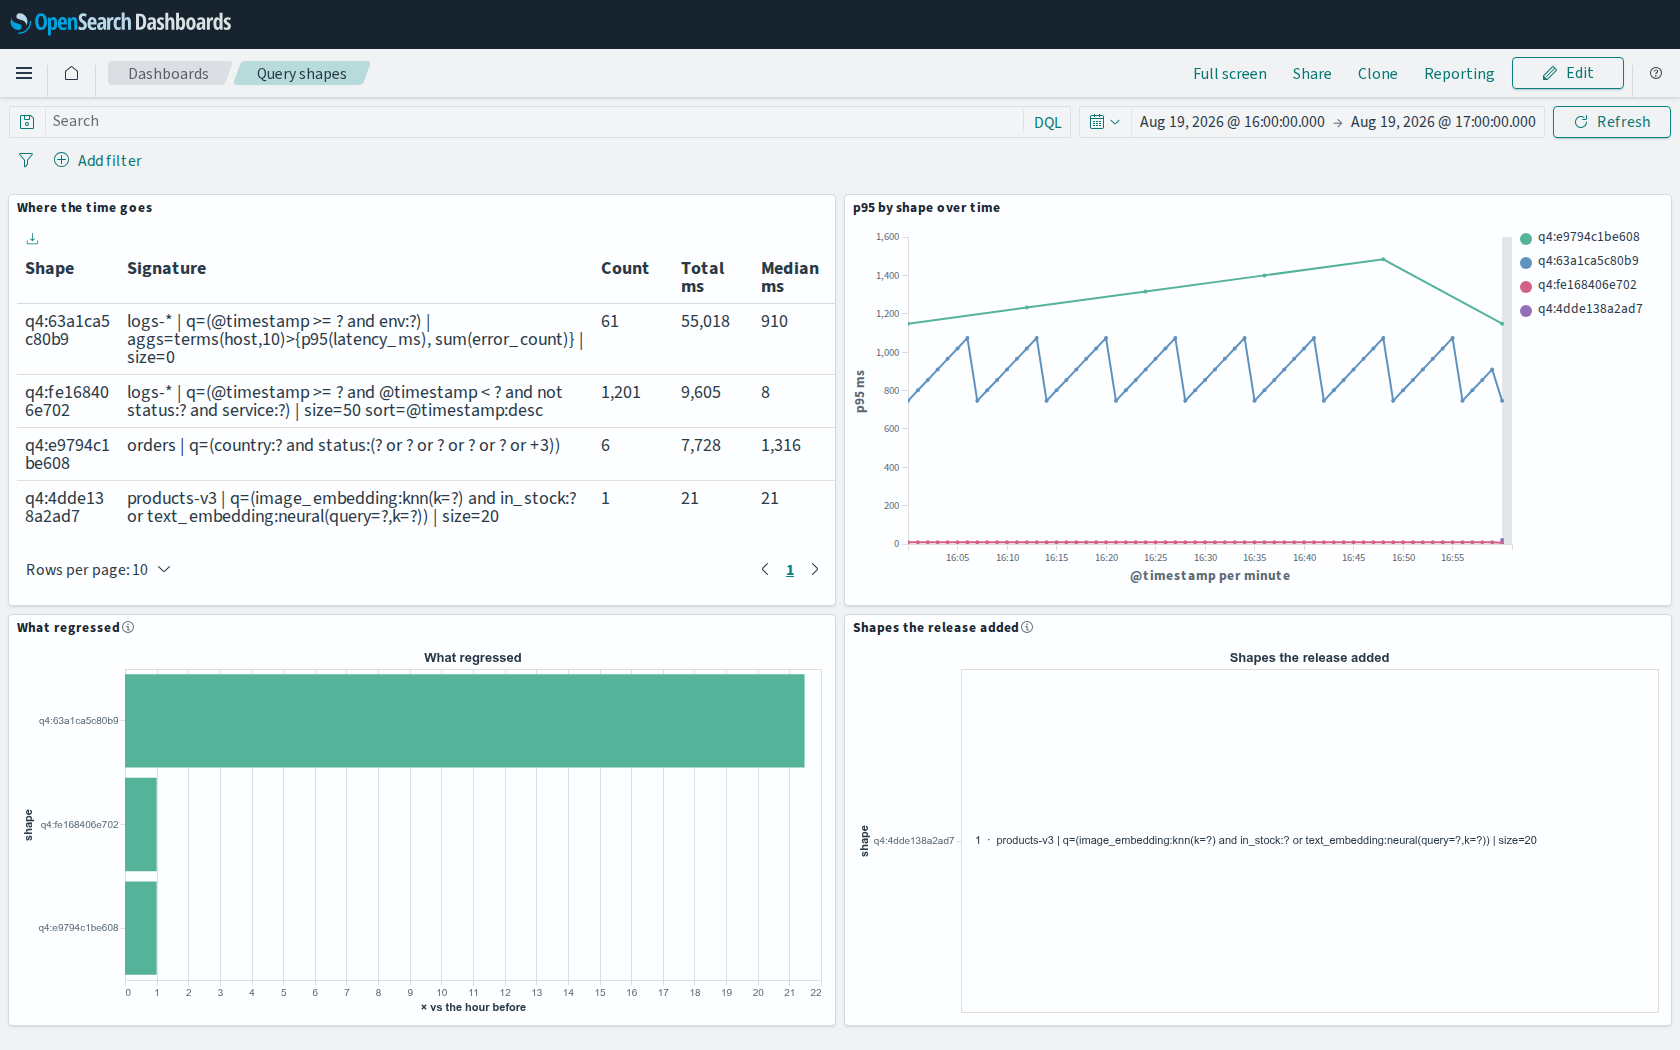
| Where the time goes | which shape costs the cluster most | terms on dsl.hash, ordered by sum(took) |
| p95 by shape over time | when a shape got slow | date_histogram, split by shape |
| What regressed | which shape got worse, against itself | bucket_script over two windows |
| Shapes the release added | what is new since an hour ago | bucket_selector on an empty before-window |
No panel reads dsl.q. All four group on dsl.hash and label with dsl.sig, so
the pack works unchanged under
withText(false) — the
field is then simply absent from the records, and it appears in the pack only in
the index pattern's field list.
dsl.kind is mapped as a keyword and no shipped panel groups on it either. It is
there so that a filter — dsl.kind: suggest — narrows all four panels at once to
one kind of work, which is the question the shipped ones cannot ask on their
own. See Kinds.
The first two are ordinary visualisations: open them, change the field, add a
metric. The last two are Vega, and not for decoration — they ask their
question with bucket_script, bucket_selector and bucket_sort, and no
classic visualisation can express a pipeline aggregation. Their specification
carries the aggregation from the page that explains it.
The one thing to change
The pack ships an index pattern named app-logs-*. If your log index is called
something else, edit index_patterns in the template and the index pattern's
title in Dashboards — or rename the two before importing:
sed -i 's/app-logs-\*/my-logs-*/' resources/dashboards/*
The second thing you may want to change is the comparison window. What
regressed and Shapes the release added compare the selected range against the
same range one hour earlier — the incident question. That is the shift and
unit pair in each Vega specification; a deploy you want to judge against
yesterday wants "shift": 1, "unit": "day".
What is verified
The pack is generated from the Use cases pages by make dashboards, and the
suite fails if what is committed is not what the generator writes today. On top
of that:
- the aggregation each Vega panel sends is executed against live OpenSearch 2.19.6 and 3.8.0 nodes, on the scenario those pages describe, and has to come back with the shape the page says it should;
- the shipped index template is applied by a real cluster, and
dsl.hashis checked to come out akeyword; - every field the pack names is checked against that template and against what the digest actually emits, so a panel cannot aggregate on a field this library stopped producing;
- no panel carries a fixed date: they follow the time picker;
- the pack is imported into a real Dashboards of each major and opened in a
browser —
make dashboards-check— where all four panels have to render, with data in them and no message in any of them. The screenshot above is the output of that run, not a picture taken once and left to rot.
That last one is the check that earned its keep. Every one of these was in the pack and invisible until a browser opened it:
| What was wrong | What it looked like |
|---|---|
a panel with no version |
the whole dashboard app throws before drawing |
a search source with no indexRefName |
Trying to initialize aggs without index pattern |
| no field list on the index pattern | fine on 2.x, Could not locate that index-pattern-field on 3.x |
%context% beside a body query |
must not be used when url.body.query is set |
%dashboard_context-*% written as objects |
Bad Request from the cluster |
%timefilter% with shift: 1 |
compares the window with the hour after it, so nothing ever regressed |
a nested value addressed as slowdown.value |
an axis of [Infinity, -Infinity], or bars normalised to 1 |
Not everything is machine-checked even so. The check asserts that panels render, carry data and report nothing; whether a chart is readable — labels not clipped, colours legible — is still a thing to look at yourself.